Free Printable Basal Body Temperature Chart – A free printable basal body temperature chart helps women in the USA track daily resting temperature to identify ovulation patterns, support trying-to-conceive efforts, or practice fertility awareness. Basal body temperature (BBT) is your body’s lowest temperature at rest, typically measured first thing in the morning. After ovulation, progesterone causes a small sustained rise (often 0.4–1.0°F), creating a biphasic pattern visible on a chart.
This resource explains how BBT charting works, how to use a printable chart correctly, where to download legitimate free versions, and what to expect. Always consult a healthcare provider for personalized advice—BBT charting is not a substitute for medical care or highly effective contraception.
What Is a Basal Body Temperature Chart?
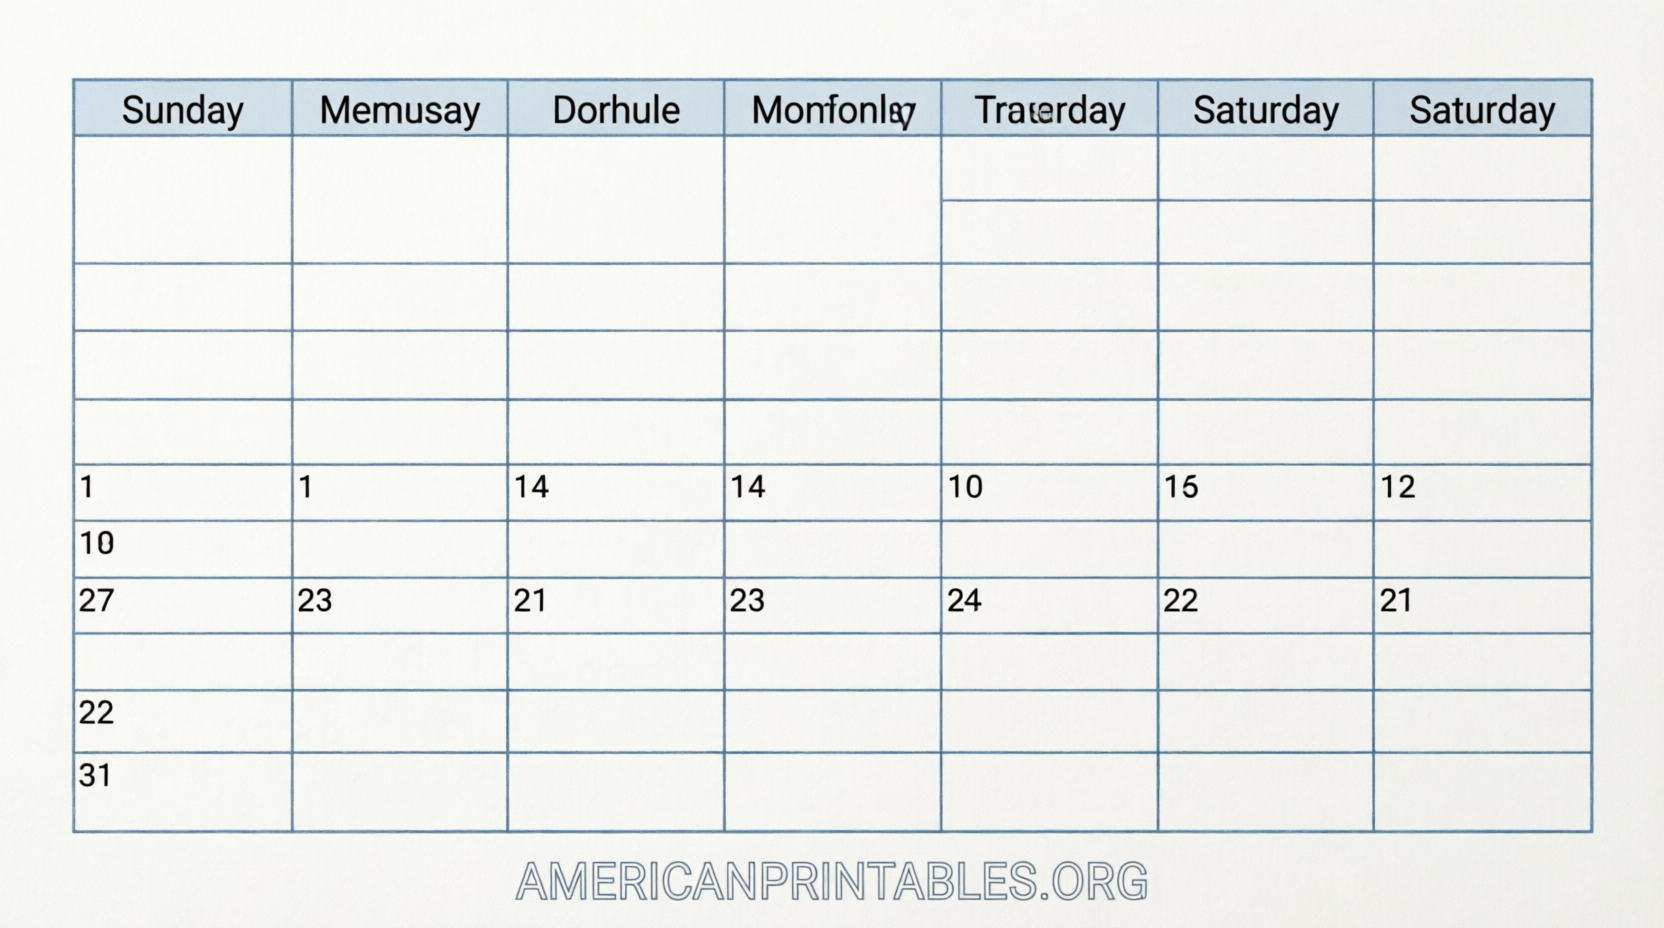
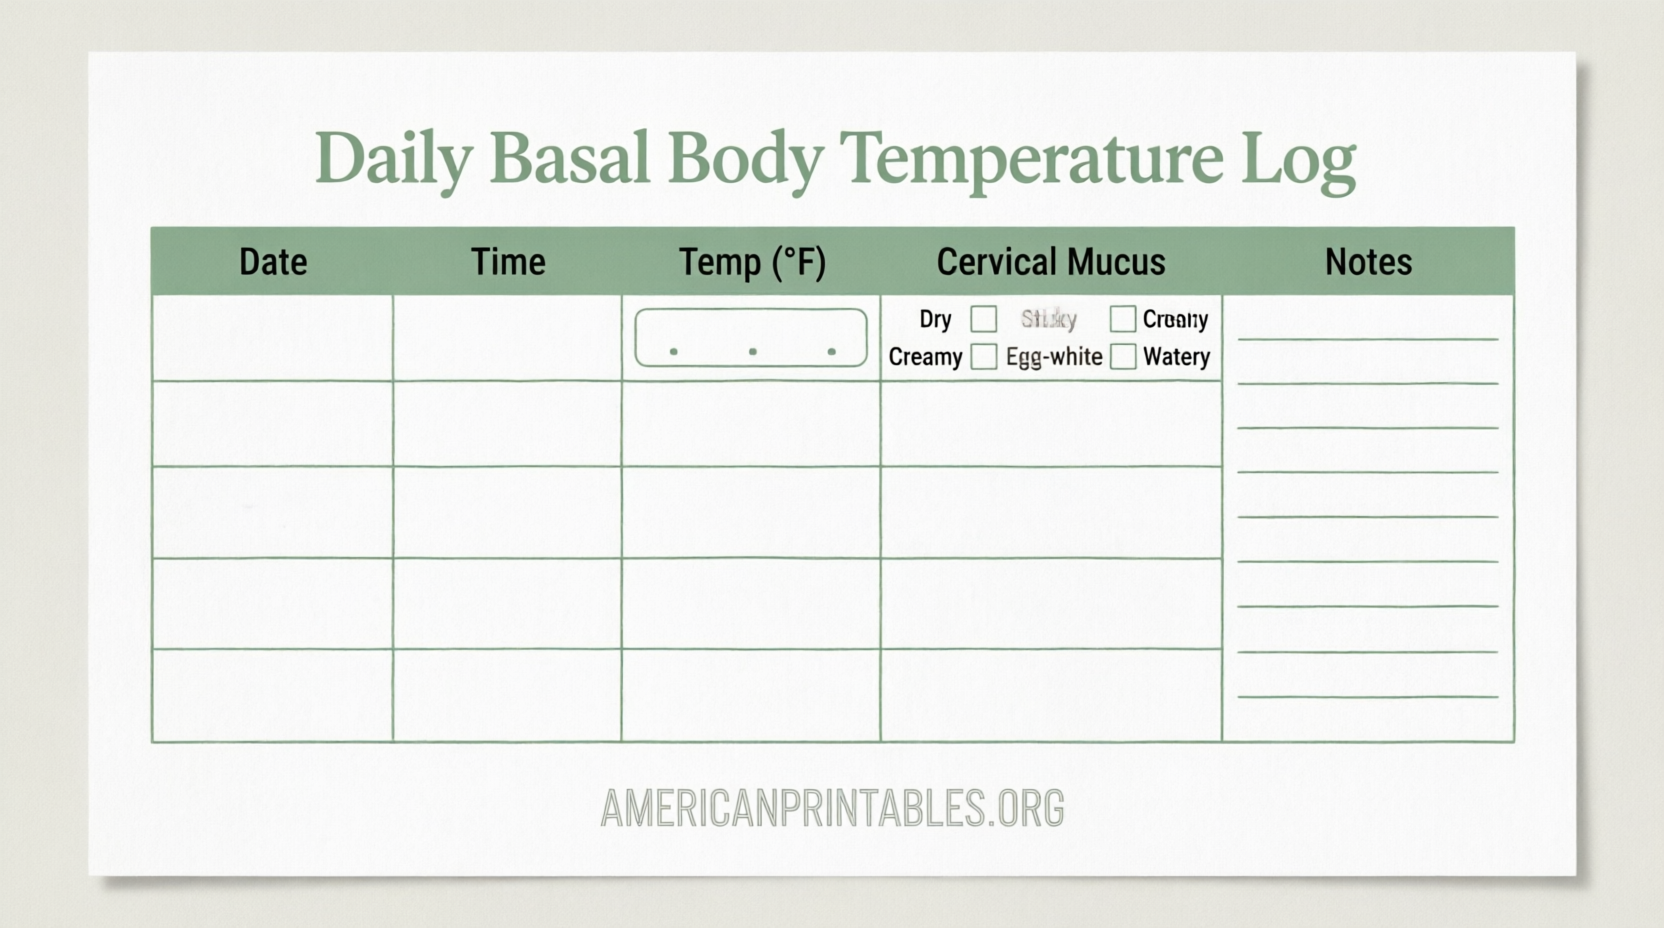
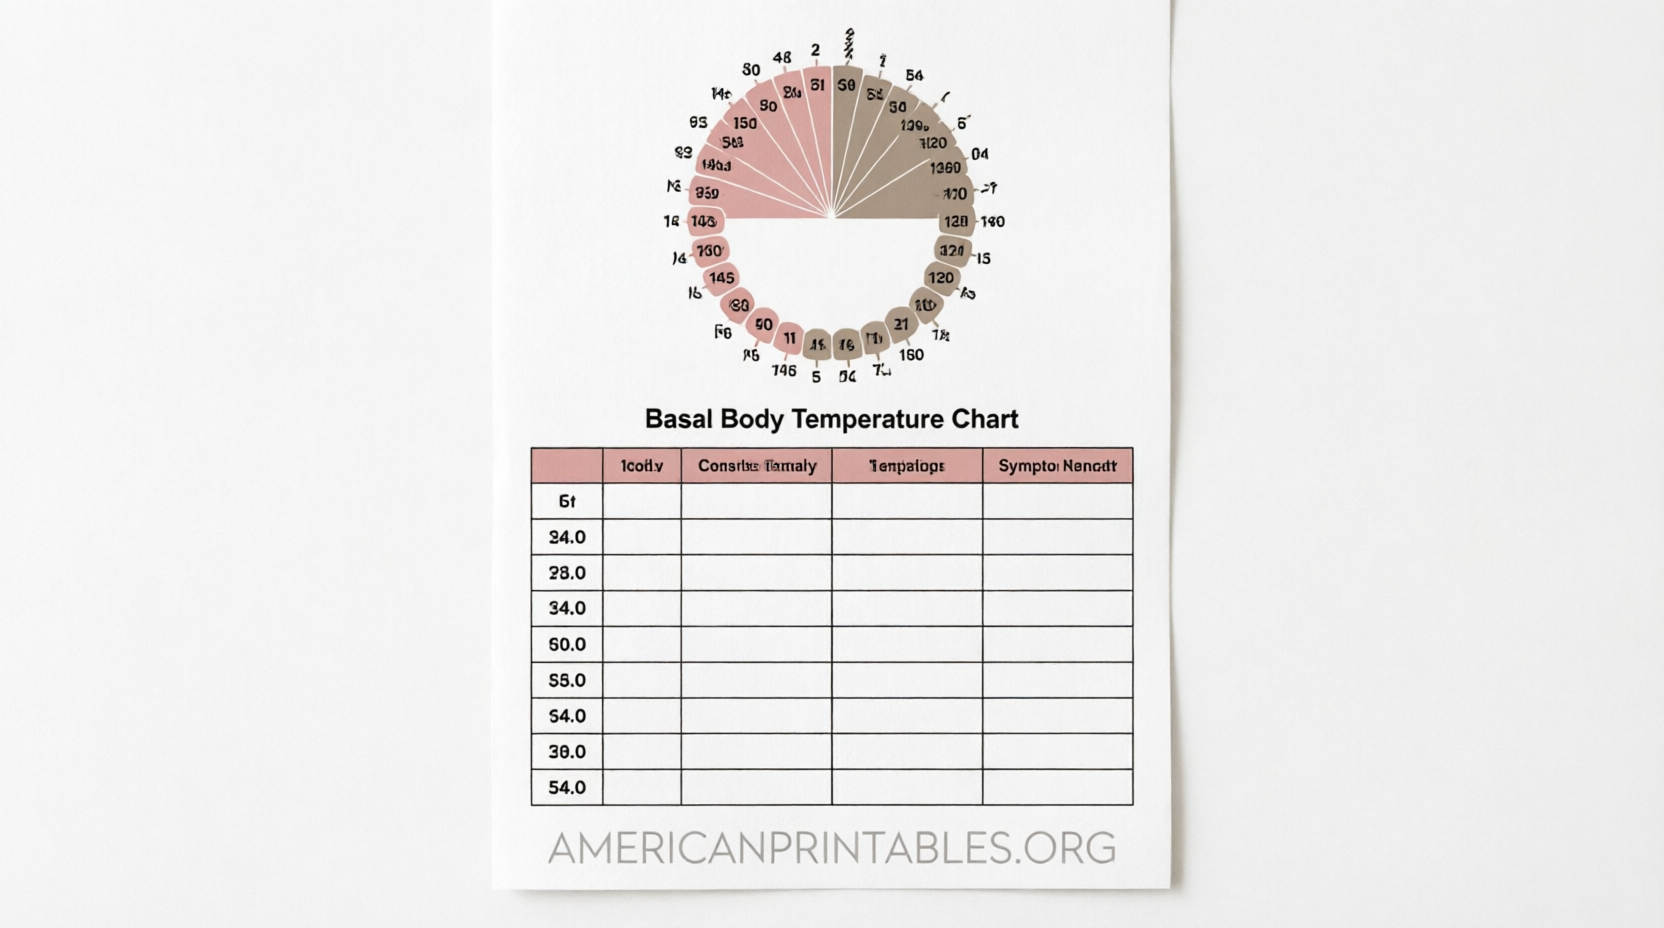
A basal body temperature chart is a simple grid or table used to record morning temperatures across a menstrual cycle (usually 28–40 days). Columns typically include cycle day, date, temperature (in Fahrenheit for U.S. users), and optional notes for cervical mucus, intercourse, symptoms, or ovulation predictor kit results.
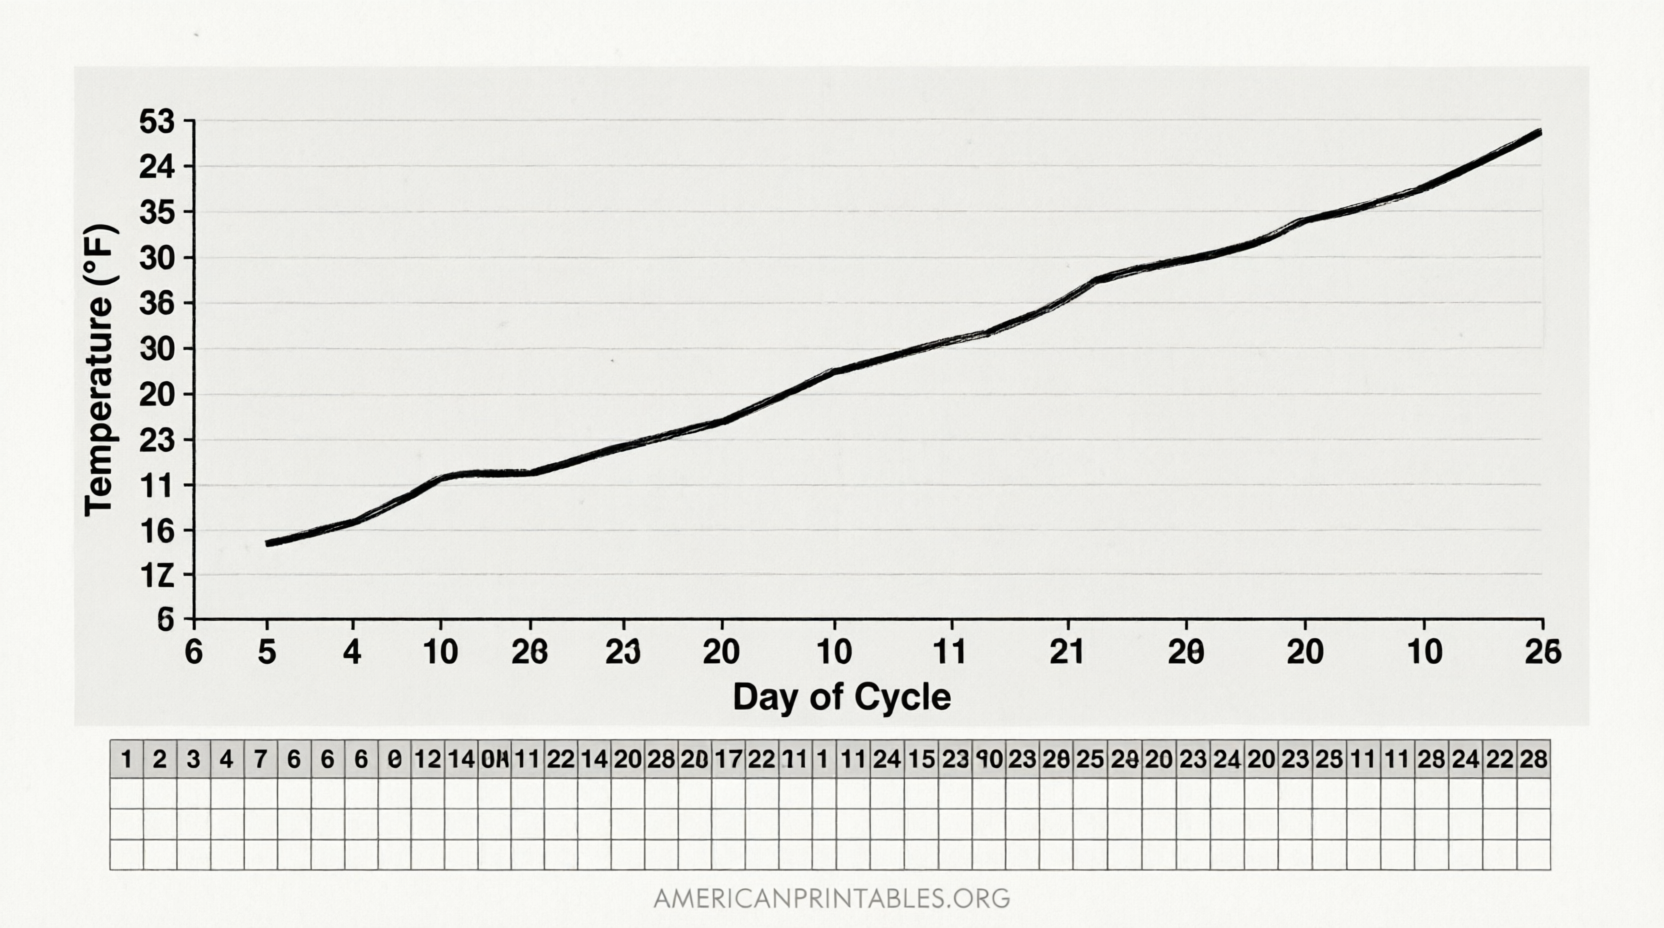
Plotting temperatures as dots and connecting them reveals patterns. Lower temperatures occur in the follicular phase (before ovulation). A sustained rise of at least 0.4°F for three or more days usually confirms ovulation has occurred.
Authoritative sources such as the Mayo Clinic note that BBT rises slightly after ovulation and that consistent measurement is essential for useful data.
How to Take and Record Basal Body Temperature Accurately?
Accuracy matters because the temperature shift is small. Follow these practical steps used by fertility awareness educators and medical sites:
- Use a basal body thermometer (accurate to 0.1°F) rather than a standard fever thermometer.
- Take your temperature at the same time every morning, before getting out of bed, talking, eating, drinking, or moving. Aim for at least three hours of uninterrupted sleep beforehand.
- Record the reading immediately on your free printable basal body temperature chart.
- Note anything that could affect the reading (illness, alcohol, late nights, travel, or medication).
- Start a new chart on the first day of menstrual bleeding (cycle day 1).
According to Planned Parenthood, temperatures are typically 96–98°F before ovulation and rise about 0.4°F afterward. Wait until you have charted several cycles before relying on patterns.
Where to Download Free Printable Basal Body Temperature Charts?
Here are legitimate, currently available free options suitable for U.S. users. All listed resources offer free downloads or printables without requiring payment (some may request an optional email).
- Carepatron provides a free downloadable PDF Basal Body Temperature Chart template that includes space for cycle day, date, temperature in both °F and °C, cervical mucus, OPK results, and notes. Access it here: Carepatron Free BBT Chart Template.
- BabyCenter offers a free blank basal body temperature and cervical mucus chart PDF designed for easy printing and daily use. Download the blank chart here: BabyCenter Blank BBT Chart PDF.
- Speedy Template hosts multiple free Basal Body Temperature Chart templates in PDF and Excel formats that can be downloaded and printed immediately: Speedy Template Free BBT Charts.
These free printable basal body temperature charts are practical for home use. Print several copies so you always have a fresh sheet ready.
Free Printable Basal Body Temperature Chart
Tips for Interpreting Your Free Printable BBT Chart
Look for a clear biphasic pattern over multiple cycles: lower temperatures in the first half of the cycle, followed by a sustained rise after ovulation. The fertile window is typically the few days before the temperature rise (sperm can survive several days) plus the day of ovulation itself.
A temperature that stays elevated for 18 or more days may be an early pregnancy indicator, but confirm with a home pregnancy test or clinician. Factors such as stress, illness, alcohol, or irregular sleep can disrupt readings—always note them on the chart.
Mayo Clinic emphasizes that BBT charting helps identify fertility patterns but is less precise when used alone for contraception compared with combining it with other fertility signs.
Brief FAQ
Is a free printable basal body temperature chart accurate enough for family planning?
It can help identify ovulation after it occurs and reveal cycle patterns, but it is most reliable when combined with cervical mucus observation or ovulation predictor kits. It is not 100% effective for avoiding pregnancy.
Do I need a special thermometer?
Yes. A basal thermometer that measures to 0.1°F provides the precision needed. Standard digital thermometers may not be sensitive enough.
How many cycles should I chart before relying on the data?
Most experts recommend at least three cycles to recognize your personal pattern.
Can BBT charting detect pregnancy?
A sustained high temperature beyond the usual luteal phase length can be an early clue, but only a pregnancy test confirms it.
A free printable basal body temperature chart is an accessible, low-cost tool for anyone wanting to understand their cycle better. Download one of the free resources linked above, start recording consistently, and review the patterns with your healthcare provider when needed. Consistent tracking over several months yields the most useful insights for fertility awareness.